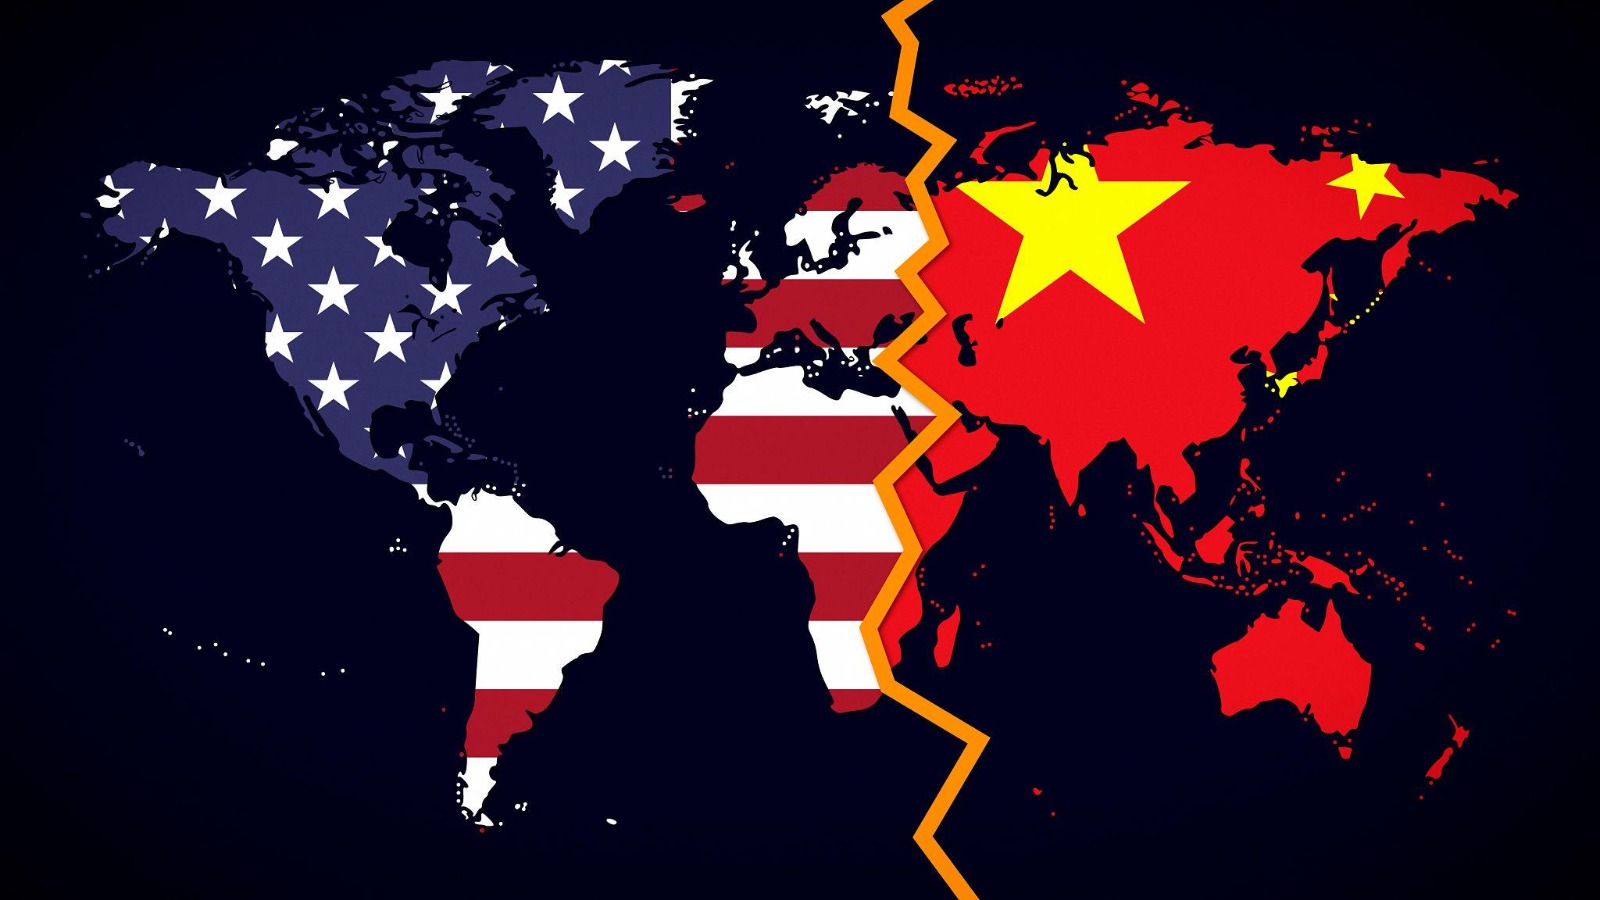
Executive summary
The United States and China remain the two most consequential powers in the international system, and how publics rate them is one of the few measurable indicators of soft power available on a cross national basis. This paper interprets the 2026 edition of that comparison, a survey of 42,151 adults in 36 countries and territories, fielded between 8 February and 13 May 2026 and published by Pew Research Center on 15 July 2026.
Pew's published headline is unambiguous. China is viewed more favourably than the United States in 25 of the 36 places surveyed, and the United States leads in six. That reverses the position that held for most of the past decade, when US favourability outpaced China's in a majority of the countries Pew surveys.
| No. | Finding |
|---|---|
| 01. | A reversal, not a rout. Average favourability across the transcribed values is 39.1 per cent for the United States and 50.8 per cent for China, with medians of 37 and 51.5. |
| 02. | Dispersion defines the picture. Margins run from a 75 point China lead in Pakistan to a 62 point US lead in Israel. |
| 03. | Allies are not shielded. Eight of ten European places rate China more favourably, and Japan records China at 50 against the United States at 11. |
| 04. | Parity, not polarity, in four places. Brazil, Colombia, Ghana and Hungary sit within five points of a tie. |
| 05. | A reconciliation flag. The transcribed values give 27 China leads and nine US leads, not the published 25 and six. |
01. Why this metric matters
Favourability is a blunt instrument, and its limits deserve stating at the outset. It is not an alliance, a trade dependency, a vote in the United Nations General Assembly or a procurement decision. A public that views China favourably may still prefer a US security guarantee, and a public that views the United States coolly may still buy American technology and host American bases.
What the measure captures is the reputational baseline against which governments negotiate, firms enter markets and coalitions are assembled. It sets the political cost of alignment. A partner government that signs a basing agreement while its public rates the counterpart power poorly pays a domestic price, and that price is a real variable in alliance management.
Three practical uses follow. For alliance managers the series is an early warning of domestic constraint on governments that remain formally aligned. For firms it is a component of country and reputational risk absent from sovereign ratings. For researchers it is a check on elite assumptions about how the world outside the transatlantic core sees the contest.
02. Data and method
Pew Research Center fielded the survey between 8 February and 13 May 2026 among 42,151 adults in 36 countries and territories, and published the results on 15 July 2026 in People in Many Countries Now View China More Positively Than the US. The percentages used here and on the interactive page are transcribed from the comparative table published by Visual Capitalist on 6 August 2026, which summarises Pew's release. All values are rounded to whole numbers.
Two properties of the series shape every inference that follows. Rounding matters, because a one point gap, as recorded in Brazil, sits inside the noise of any statement about which power leads there. And a secondary transcription is not the primary record, so a figure that matters for a filing or an investment case should be checked against Pew's original data.
The region labels, being Asia-Pacific, Europe, the Americas, and the Middle East and Africa, are Totus Institute groupings for presentation and are not Pew categories. Averages across places are unweighted, so they describe the set of countries surveyed rather than the world's population.
03. The published headline
China is viewed more favourably than the United States in 25 of the 36 places surveyed, with the United States ahead in six. Pew attributes the shift to two movements acting together, declining views of the United States and improving views of China. The finding has travelled well beyond the research community, and the Council on Foreign Relations analysis of it asks plainly what changed.
The arithmetic of the headline is worth pausing on. Twenty-five and six account for 31 of the 36 places, which leaves five unassigned to either lead category in the published summary. That is the first indication that the summary counts and the country level table rest on slightly different footings, and section 04 quantifies the gap.
04. The shape of the distribution
The 36 transcribed values, treated as an unweighted set of national readings, produce the following profile.
| Measure | United States | China |
|---|---|---|
| Average favourability | 39.1 | 50.8 |
| Median favourability | 37 | 51.5 |
| Highest reading | 81 in Israel | 90 in Pakistan |
| Lowest reading | 9 in West Bank and East Jerusalem | 11 in Japan |
The width of the distribution is the finding. Pakistan records China at 90 against a US reading of 15, a margin of 75 points, while Israel records the United States at 81 against China at 19, a margin of 62 points the other way. The same instrument, in the same fieldwork window, produces two opposite extremes, and averaging them into a single global verdict discards most of the information in the survey.
Four places sit within five points of parity. Brazil records 47 against 46, Colombia 60 against 63, Ghana 68 against 64 and Hungary 58 against 53. In a rounded series these are effectively ties and should be reported as such rather than assigned to a camp.
Reconciliation note
Counted directly, the transcribed values give 27 places where China's rounded percentage exceeds the US figure and nine where the US figure is higher, with no ties. Pew's published summary reports 25 and six, and the difference of two places in each direction cannot be resolved from rounded secondary values.
Three explanations are consistent with the evidence. Rounding at the boundary of a lead category, a difference between the question series summarised in the release and the series tabulated in the comparison, or transcription error in the secondary table. This paper reports Pew's published counts as authoritative and discloses the transcribed counts alongside them.
05. Where each power leads
The largest gaps in each direction, ranked by margin, which is China's favourability less that of the United States in percentage points.
| Leader | Place | US | China | Margin |
|---|---|---|---|---|
| China | Pakistan | 15 | 90 | China +75 |
| China | Malaysia | 19 | 75 | China +56 |
| China | Singapore | 34 | 73 | China +39 |
| China | West Bank and East Jerusalem | 9 | 57 | China +48 |
| United States | Israel | 81 | 19 | US +62 |
| United States | Japan | 50 | 11 | US +39 |
| United States | South Korea | 45 | 28 | US +17 |
| United States | India | 45 | 23 | US +22 |
The China leading column is dominated by large, young, fast urbanising populations in South and South East Asia, by Muslim majority societies across three regions, and by places where Chinese infrastructure and consumer goods are a visible part of daily economic life. The US leading list is short and heterogeneous, pairing one Middle Eastern partner with an intimate security relationship, three Indo-Pacific partners with contested borders or deepening defence ties, and two central European members of NATO.
The asymmetry is informative. China's advantage is broad and shallow across most of the map, while the US advantage is narrow and deep where it exists at all. Broad shallow support is easier to win and easier to lose, and narrow deep support is more durable but travels badly.
06. Regional patterns
Regional averages are unweighted across the places surveyed in each grouping.
| Region | Places | US average | China average | Average margin |
|---|---|---|---|---|
| Asia-Pacific | 12 | 35.1 | 53.3 | China +18.3 |
| Europe | 10 | 34.4 | 42.8 | China +8.4 |
| The Americas | 7 | 44.6 | 53.1 | China +8.6 |
| Middle East and Africa | 7 | 47.4 | 55.6 | China +8.1 |
Europe is the most uniformly China leaning region in relative terms, with eight of ten places recording a higher China rating, although the average margin is modest at 8.4 points and both exceptions sit in central Europe. Asia-Pacific is not a bloc. It contains the survey's largest China margin and its second largest US margin, and its internal range of 114 points, from Pakistan at plus 75 to Japan at minus 39, is wider than any difference between regional averages.
The Middle East and Africa records the highest absolute favourability readings for both powers, at 47.4 and 55.6, which is consistent with publics that rate foreign powers generously across the board rather than with a decisive tilt towards either.
07. The alliance paradox
The most policy relevant finding in this paper is not the headline count. It is that long standing treaty partners of the United States appear throughout the China leading column.
| Treaty partner | US | China | Margin |
|---|---|---|---|
| Japan | 11 | 50 | China +39 |
| Australia | 24 | 31 | China +7 |
| Canada | 33 | 44 | China +11 |
| United Kingdom | 41 | 46 | China +5 |
| Germany | 27 | 33 | China +6 |
| France | 27 | 36 | China +9 |
| Italy | 31 | 51 | China +20 |
| Spain | 30 | 54 | China +24 |
That pattern separates two things analysts often treat as one, the security relationship a government maintains and the reputation the counterpart power holds with that country's public. Three readings are consistent with the data and none can be settled with a single cross section. The readings may capture a shock rather than a realignment, since they describe a sixteen week window. They may reflect issue separation, with publics discounting the United States on trade while relying on it for security. Or they may measure presence rather than preference, with China's ratings driven by economic visibility.
India rewards careful reading. New Delhi records its strongest relative US reading in the survey, at 45 against 23, while remaining a member of BRICS and a participant in Indo-Pacific arrangements. Membership of a club is not a statement of favourability, and favourability is not a statement of alignment, which is why India's posture is best described as multi-alignment.
Israel is the mirror case and the most lopsided reading in the survey, with the United States at 81 and China at 19. Whatever mechanism drives favourability elsewhere is visibly not operating in the same way there.
08. Candidate drivers
The survey measures attitudes rather than causes. Four mechanisms are consistent with the pattern, and all four are offered as hypotheses for testing rather than as findings.
| No. | Mechanism | What would support it |
|---|---|---|
| 01. | Transaction costs and tariff exposure | Favourability moves where a public carries a trade measure as a direct cost to household income, with the largest declines in export exposed economies. |
| 02. | Conflict fatigue | Declining US readings in Japan and South Korea coincide with domestic debate over defence cost sharing. |
| 03. | Visible development finance | Ports, rail corridors and energy projects give a creditor state a physical presence, and the highest China ratings cluster where such projects are prominent. |
| 04. | Information environments | Where the domestic information diet is dominated by platforms on which Chinese state media is active, the reputational baseline shifts. |
Separating these mechanisms would require panel data, issue level question batteries or event studies around specific announcements. None is available in this series and none has been substituted. Commentary on the result, from the Council on Foreign Relations and from Chinese state media, reads it through different priors, which is itself a reminder that interpreting a survey is not a neutral act.
09. What to watch
Four signals will determine whether the 2026 readings mark a durable shift.
| No. | Signal | Why it matters |
|---|---|---|
| 01. | Reversion risk | Historical figures supplied with this study put US favourability in South Korea at 77 per cent in 2024 against 45 in 2026, and in Japan at 70 against 50. Both are flagged for verification, but movements of this size warn against reading one wave as a verdict. |
| 02. | Issue level divergence | General favourability and support for specific cooperation, in semiconductors, basing access or export controls, frequently move in opposite directions. |
| 03. | Generational composition | Age structure is the most plausible source of durable change, and the published summary does not disaggregate by cohort. |
| 04. | Data quality | Every country level figure here should be verified against Pew's original release. |
Peer reviewed work on the drivers of cross national opinion, listed below, continues to test mechanisms one wave cannot identify.
10. Implications
Governments and alliance managers
Formal alignment and public sentiment are diverging across much of the alliance system. Treating a treaty as evidence of public support, or a favourable reading as evidence of alignment, will misread both. Coalition building now requires separate work on the security file and on the reputational file, and the second is where the constraint is forming.
Firms and investors
Favourability is a leading indicator of regulatory and consumer risk at the margin rather than a macroeconomic variable. The signal that matters is the direction and size of the margin in markets where a firm must choose a technology stack, a supplier base or a public position. Markets within five points of parity should be modelled as genuinely undecided.
Researchers
The published headline and the country level table do not reconcile exactly, and that gap is itself a finding about how survey releases travel. Analysts should work from primary data, publish their own reconciliation, and resist compressing 36 national readings into one global number.
Limitations
| No. | Limitation |
|---|---|
| 01. | Country percentages are rounded and transcribed from a secondary summary rather than from Pew's primary release. |
| 02. | Averages are unweighted across surveyed places and do not represent the world's population. |
| 03. | The series is a single cross section and cannot identify trend, causality or persistence. |
| 04. | Favourability is not alignment, and no statement here treats it as such. |
| 05. | Five places are not assigned to a lead category in the published summary. |
| 06. | Region groupings are editorial and are not Pew categories. |
References
Statistics in sections 04 and 06 are calculated from the transcribed country table and are reproducible from the interactive companion page, which publishes all 36 values.
About the Author

Dean Marc
Contributor at Totus Institute. Researching politics and related fields.